
Executive summary
Water is among the inputs that most often limit crop yield, and farms are where most of it is used: agriculture accounts for roughly 70% of global freshwater withdrawals [1], and drought and extreme heat have cut national cereal production by about 9–10% on average [2]. The soil is where that water is either held in reach of the roots or lost to runoff, evaporation and drainage. Anything that changes how soil aggregates form, how fast water enters, and how much it keeps is therefore a candidate tool for water management.
This review looks at how one biopolymer acts on those properties: poly-γ-glutamic acid, more commonly known as polyglutamic acid, or PGA. PGA is a water-soluble polyamino acid produced by fermentation, carrying a free carboxyl group on every residue. This review covers linear polyglutamic acid, the water-soluble form, whether sold as a purified powder or as a crude fermentation product. A chemically distinct crosslinked version, sold as a superabsorbent, is a different material and is outside this paper.
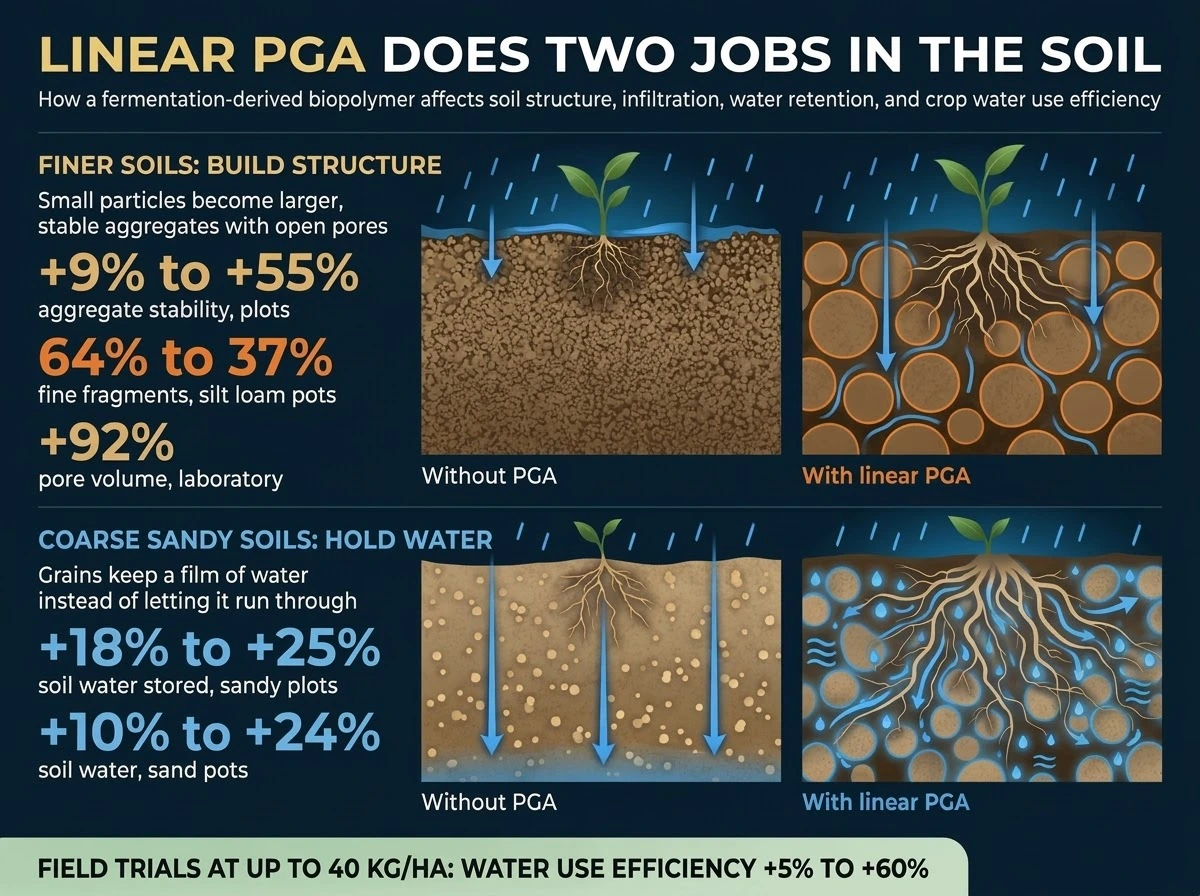
Three findings are supported across independent study designs. First, soil structure improves: in built sandy-soil plots the mean weight diameter of water-stable aggregates rose from 0.46 mm to 0.64 mm at the highest rate, and in wheat pots it rose from 0.34 mm to 0.60 mm [3, 4]. Second, water enters soil more slowly and the soil holds more at saturation: cumulative infiltration fell in every column or field infiltration test reviewed, by 3.9% to more than 50% depending on dose [5, 6, 7, 25], and saturated water content rose by about 3% to 13% in four studies [4, 8, 9, 13]. Third, water use efficiency rose in all four field and built-plot trials that measured it at rates up to 40 kg per hectare as reported, by 5% to 60% depending on trial and rate [10, 11, 12, 13]. In most of these trials evapotranspiration did not change, so the gain came from more yield per unit of water, not from using less.
The evidence comes from many settings: open-field wheat, maize and cotton, built-plot cotton and soybean, lab soil columns, and greenhouse pots of cereals, legumes, forage and a medicinal herb. Winter wheat used water 4.8% to 9.8% more efficiently, with no change in the amount of water applied [10]. Drip-irrigated cotton in salty, alkaline soil did improved with increasing levels of PGA [11]. Soybean micro-plots improved by 19% to 60% [12]. In sandy-soil cotton plots, the water held in the soil after irrigation rose from 51.7 mm to 74.8 mm at one of the rates in one growth stage [13]. Separate greenhouse studies found that plants coped better with drought when given very small amounts of PGA, either as a leaf spray or in the irrigation water [14, 15, 16]. The evidence comes mostly from China and a small number of research groups, so independent field validation, with evapotranspiration and infiltration measured in the same plots, is the logical next step before rates are scaled (Section 6).
1. Water in cropping systems, at scale
1.1 What water use efficiency measures
Water use efficiency is not one metric, and the distinction matters when comparing claims across crops or studies. Crop water use efficiency (WUE) expresses yield per unit of evapotranspiration (ET), the water that leaves the field through the crop and the soil surface, usually in kilograms of grain per hectare per millimeter. Irrigation water use efficiency expresses yield per unit of irrigation applied. Water productivity can also be expressed per cubic meter. [18]
These numbers can move independently. WUE rises when yield rises at the same ET, when ET falls at the same yield, or when both move. Several of the studies reviewed here report WUE gains of 20% to 60%, so it matters which of the two moved. Throughout this review, WUE means yield per unit of ET unless stated otherwise, and where a study reports only yield, or only irrigation, we say so.
1.2 Where soil water is lost or limited
Water applied to or falling on a field has four fates. It runs off the surface, evaporates from the soil, drains below the root zone, or is taken up by the crop. Soil structure influences all four. Aggregated soils with stable pores let water in and hold it near the roots; soils with weak or collapsed structure form crusts that shed water and drain or dry quickly. Coarse sandy soils, which dominate the studies reviewed here, hold little water at field capacity and lose it to drainage and evaporation; several of the trials were run on desertified or aeolian sand precisely for this reason [3, 19].
Two further terms recur. Saturated water content is the water a soil holds when every pore is full. Plant-available water is the difference between field capacity, what the soil holds after free drainage, and the permanent wilting point, below which roots cannot extract water. A treatment can raise saturated content without raising plantavailable water, and the literature does not always say which it measured. Section 2 returns to this.
1.3 The evidence base for polyglutamic acid: crops and systems represented
Studies are sorted by how close they are to a farmer's field. Tier A is open-field plots. Tier B is built plots or soil boxes in the field, where the soil is placed rather than native. Tier C is laboratory soil physics on packed soil or columns. Tier D is pots, greenhouse and seedling studies. Tier colours run from green (A) through yellow (B) and orange (C) to purple (D).
| Study | Location, system | Crop or soil | Route | Tier |
|---|---|---|---|---|
| Guo 2023 [10] | Taiyuan; open field | Winter wheat, clay loam | Soil-applied | A |
| Liu 2026 [11] | Shihezi; open field, drip, 2 seasons | Cotton, saline-alkali soil | Drip fertigation | A |
| Wang Y 2025 [20] | Henan; open field | Summer maize | Foliar | A |
| Fu 2024 [21] | Henan; open field | Maize | Soil-applied | A |
| Skalski 2024 [17] | Poland; field plots | Grassland, sandy soil | Soil drench | A |
| Shiheng 2025 [7] | Chengdu; open field | Winter wheat, urban abandoned land | Soil-mixed and soil spray | A |
| Zhai 2024 [22] | Wuwei; mulched drip, 2 seasons | Maize | Soil-applied | A or B |
| Liang and Shi 2021; Liang 2019 [3, 13] | Korla; built plots, 2 seasons | Cotton, sandy soil | Soil, brackish drip | B |
| Jing 2024b [12] | Wuwei; micro-plots | Soybean | Drip fertigation | B |
| Guo 2021 [5] | Laboratory columns | Sandy loam | Mixed in soil | C |
| Lin 2026 [6] | Laboratory columns | Acidic red soil | Mixed in soil | C |
| Gao 2024 [8] | Laboratory columns, simulation | Sandy loam | Mixed in soil | C |
| Liu 2023 [23] | Laboratory, micro-CT | Sand and loam | Mixed in soil | C |
| Jing 2024a [9] | Laboratory, micro-CT | Silty loam | Mixed in soil | C |
| Liu P 2024 [24] | Laboratory columns | Coastal saline soil | Mixed in soil | C |
| Hong 2024 [25] | Pots, drought | Maize, soil | Broth mixed in soil | C and D |
| Shi 2023 [4] | Pots under shelter | Winter wheat, silt loam | Mixed in soil | D |
| Guo Z 2024 [19] | Pots | Alfalfa, aeolian sand | Mixed in soil | D |
| Liu and Shi 2023 [26] | Pots | Soybean seedlings, sand and sandy loam | Mixed in soil | D |
| Wang X 2025 [27] | Pots | Cabbage and lettuce, garden soil | Crude product mixed in soil | D |
| Yin 2018 [28] | Pots, drought | Maize seedlings | Broth applied to soil | D |
| Shan and Zhang 2024 [14] | Pots, three water regimes | Salvia miltiorrhiza | Foliar | D |
| Ma 2022 [15] | Soil boxes, drought | Maize seedlings | Watering | D |
| Wang Z 2025 [16] | Pots, drought | Cotton seedlings | Irrigation water | D |
| Dueñas 2024 [29] | Soil trays, three moistures | Rice, 11 varieties | Seed priming | D |
Seven of the studies are open-field trials, and four of those reported water use efficiency.
2. How soil holds and moves water
2.1 Structure and aggregation
Soil particles bind into aggregates, clusters of mineral grains held by organic matter, clay, and microbial products. The spaces between and within aggregates are the pores through which water and air move. Aggregate stability, how well those clusters survive wetting and raindrop impact, is usually reported as mean weight diameter (MWD) of water-stable aggregates, or as the share of fine fragments (below 0.25 mm or 0.5 mm) left after wet sieving. A higher MWD and a smaller fine fraction indicate a more stable structure. The studies reviewed here use both measures [3, 4, 9].
Sandy and desertified soils have little clay and little organic matter, so they aggregate poorly. That is why most of the PGA literature sits on sandy, sandy loam or silty soils: there is a larger gap to close, and a polymer that bridges particles has more to do.
2.2 Infiltration and drainage
Infiltration is the rate at which water enters the soil surface; drainage is the downward movement of water below the root zone. A coarse sandy soil takes water in fast and lets it pass. A crusted or compacted soil takes it in slowly and sheds the rest as runoff. Neither extreme is desirable, which is why a treatment that slows infiltration is not automatically a harm. In a sand that drains within hours, slower entry can mean longer contact time with the root zone; in a crusting soil under heavy rain it could increase runoff. The laboratory columns reviewed here cannot tell these apart [5, 8], and among the open-field studies only one measured infiltration [7].
2.3 Storage, field capacity and plant-available water
Four soil water terms recur through the review. They are defined in the table below, along with why each matters to a crop.
| Term | Meaning | Why it matters |
|---|---|---|
| Saturated water content | Water held when every pore is full | Upper bound of storage; short-lived after rain or irrigation |
| Field capacity | Water held after free drainage has stopped | What the soil stores for the crop between events |
| Permanent wilting point | Water held so tightly roots cannot extract it | Lower bound of useful water |
| Plant-available water | Field capacity minus wilting point | The reservoir the crop actually draws on |
A treatment can raise saturated content without moving plant-available water, because added pore space near saturation drains out quickly. This is the central interpretive caution for the whole review. Where a paper reports only saturated or "maximum" water holding, we say so, and we do not treat it as evidence of more water available to the crop. Section 4.2 sets out which studies measured which quantity.
3. What polyglutamic acid is and how it was applied
3.1 Structure and origin
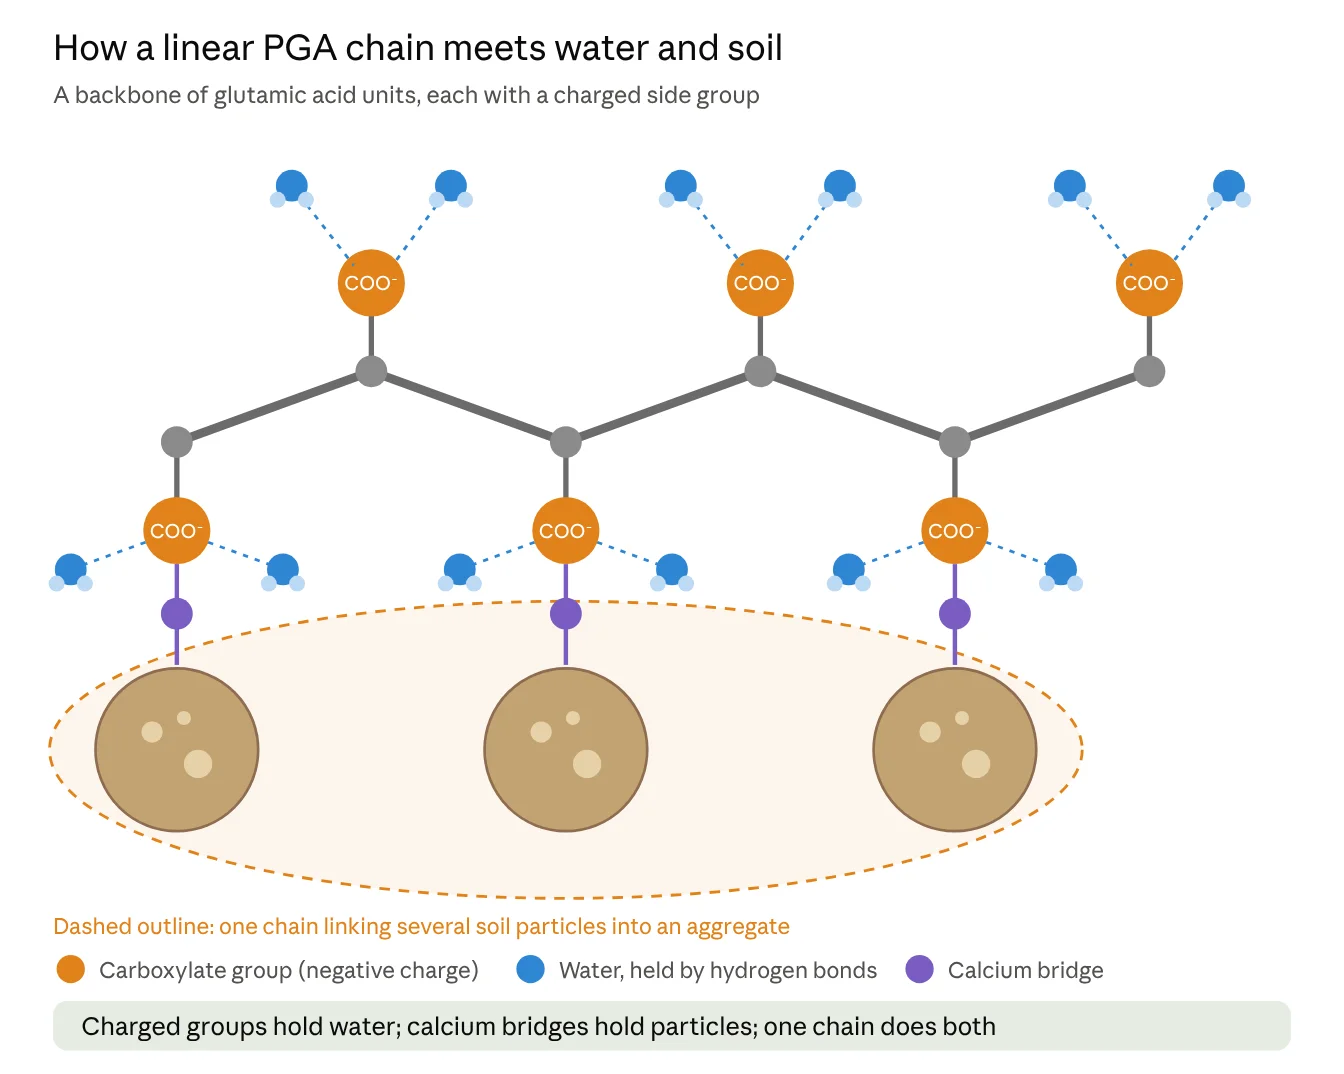
Polyglutamic acid is a polymer of the amino acid glutamic acid. In the γ form studied in agriculture, the chain is joined through the γ-carboxyl group of each residue, which leaves the α-carboxyl group free; this gives the molecule a high density of negative charge and a strong affinity for water and for cations. It is made commercially by bacterial fermentation, usually with Bacillus species. Chain length varies with the producing strain and the process, and at least one study in this review tested molecular weight directly [6]. Most papers report neither molecular weight nor degree of purity of the material they applied, which limits comparison.
This review covers the linear, water-soluble polymer. The crosslinked polymer, sold as a superabsorbent, is a different material with a different mode of action, and the studies on it are not used here. Where a paper tested both, only the linear arm is used [5, 10].
3.2 Product forms and purity
Papers describe four product forms, and the form determines what a stated dose means.
- Purified powder, with purities stated between 92% and 95% in two laboratory studies [6, 24].
- Ag-grade solid, sold as a diluted product. Stated purities include 25% [14], 30% [9, 19] and 35% [11].
- Crude solid from solid-state fermentation, containing about 5.5% PGA [27].
- Liquid or fermentation broth, containing roughly 6 g PGA per liter [20, 28]. One study applied broth without reporting its PGA content [25].
The practical point is that a dose of "40 kg/ha" of a 25% product is 10 kg of PGA, while 40 kg/ha of a 95% powder is 38 kg. Of the studies that report a rate in kilograms per hectare, several state the rate as product and some as PGA. The tables in this review always say which basis is used, and where the paper does not state the purity, we say that too.
3.3 Reading doses across studies
Doses are reported on three different bases. Field and built-plot trials give kilograms per hectare, either of product or of PGA. Pot and laboratory studies usually give a mass fraction of the soil, in percent or grams per kilogram. Foliar and irrigation-water studies give a concentration of the liquid. A rough conversion makes the first two comparable: for the top 15 cm of a soil with a bulk density of 1.4 g/cm³, which holds about 2.1 million kilograms of soil per hectare, one kilogram of product per hectare is about 0.00005% of the soil by mass.
| Study | Setting | Rate | Basis |
|---|---|---|---|
| Guo 2023 [10] | Field wheat | 40–160 kg/ha | Product |
| Liu 2026 [11] | Field cotton, drip | 7.5–30 kg/ha (2.6–10.5 PGA) | Product, 35% purity |
| Jing 2024b [12] | Soybean plots | 10–80 kg/ha | As reported |
| Liang and Shi 2021 [3] | Cotton plots | 20–160 kg/ha | Product |
| Wang Y 2025 [20] | Field maize, foliar | ~50 g PGA/ha per spray | PGA, assumed |
| Liu and Shi 2023 [26] | Pots | Up to 5 g/kg soil | Soil mass |
The table shows how far apart the scales are. A field rate of 20 to 160 kg of product per hectare corresponds to about 0.001% to 0.008% of the top 15 cm of soil by mass, while the pot and column tests used between 0.05% and 6%, a gap of from about six-fold to several thousand-fold. That does not make the laboratory results wrong, but it means that the largest soil-structure effects in them come from doses a farmer would not apply. This review therefore relies on the field and built-plot rates for any statement about practice, and uses the laboratory work to explain mechanisms.
4. Evidence across cropping systems
4.1 Soil structure and aggregation
Aggregation is the most consistently reported effect: in every study that measured it, large water-stable aggregates increased and fine fragments decreased.
| Study | System | Rate | Result |
|---|---|---|---|
| Liang and Shi [3] | Cotton plots | 20–160 kg/ha | MWD 0.46 → 0.64 mm; fines <0.25 mm 55% → 38% |
| Jing 2024b [12] | Soybean plots | 10–80 kg/ha | MWD +9% to +55%, peak at 40 kg/ha |
| Shi 2023 [4] | Wheat pots | 0.05–0.15% of soil | MWD 0.34 → 0.60 mm; fines <0.5 mm 64% → 37% |
| Jing 2024a [9] | Laboratory | As reported | MWD +17%; pore volume +92% |
| Hong 2024 [25] | Maize pots, broth | 2 g/kg | Macroaggregates +65% |
| Shiheng 2025 [7] | Field wheat | As reported | Bulk density 1.53 → 1.34 g/cm³ |
| Zhai 2024 [22] | Field maize | 20–80 kg/ha | Better pore structure |
The plot results came at field-relevant rates; the pot and laboratory results came at much higher soil concentrations (Section 3.3).
4.2 Infiltration and water retention
Studies measured infiltration, saturated water and storage in different ways; the table keeps them apart.
| Study | Measure | Result |
|---|---|---|
| Guo 2021 [5] | Infiltration, columns | −21% to −55% |
| Lin 2026 [6] | Infiltration, columns | −22% to −90% |
| Shiheng 2025 [7] | Infiltration, field | −4% to −11% |
| Hong 2024 [25] | Infiltration, pots | −32% |
| Gao 2024 [8] | Saturated water | +3% to +11% |
| Shi 2023 [4] | Saturated water; field capacity | +6% to +12%; +15% |
| Shi 2023 [4] | Drying time, pots | 3.9 → 8.8 days |
| Liang 2019 [13] | Saturated water, laboratory | 0.310 → 0.348 |
| Liu P 2024 [24] | Evaporation, columns | −31% |
| Liang and Shi [3] | Soil water storage, plots | 44 → 52–58 mm |
| Guo Z 2024 [19] | Soil moisture, pots | +42% to +77% |
| Yin 2018 [28] | Soil water, pots | 8.3% → 9.2% |
| Zhai 2024 [22] | Soil water storage | +2% to +27% |
| Guo 2023 [10] | Soil water, open field | −3% to −5% |
In short, infiltration slows, saturated and field-capacity water rise, and storage rose in sand, plots and pots. Plantavailable water did not rise significantly in the two studies that measured it [4, 5].
4.3 Crop water use efficiency
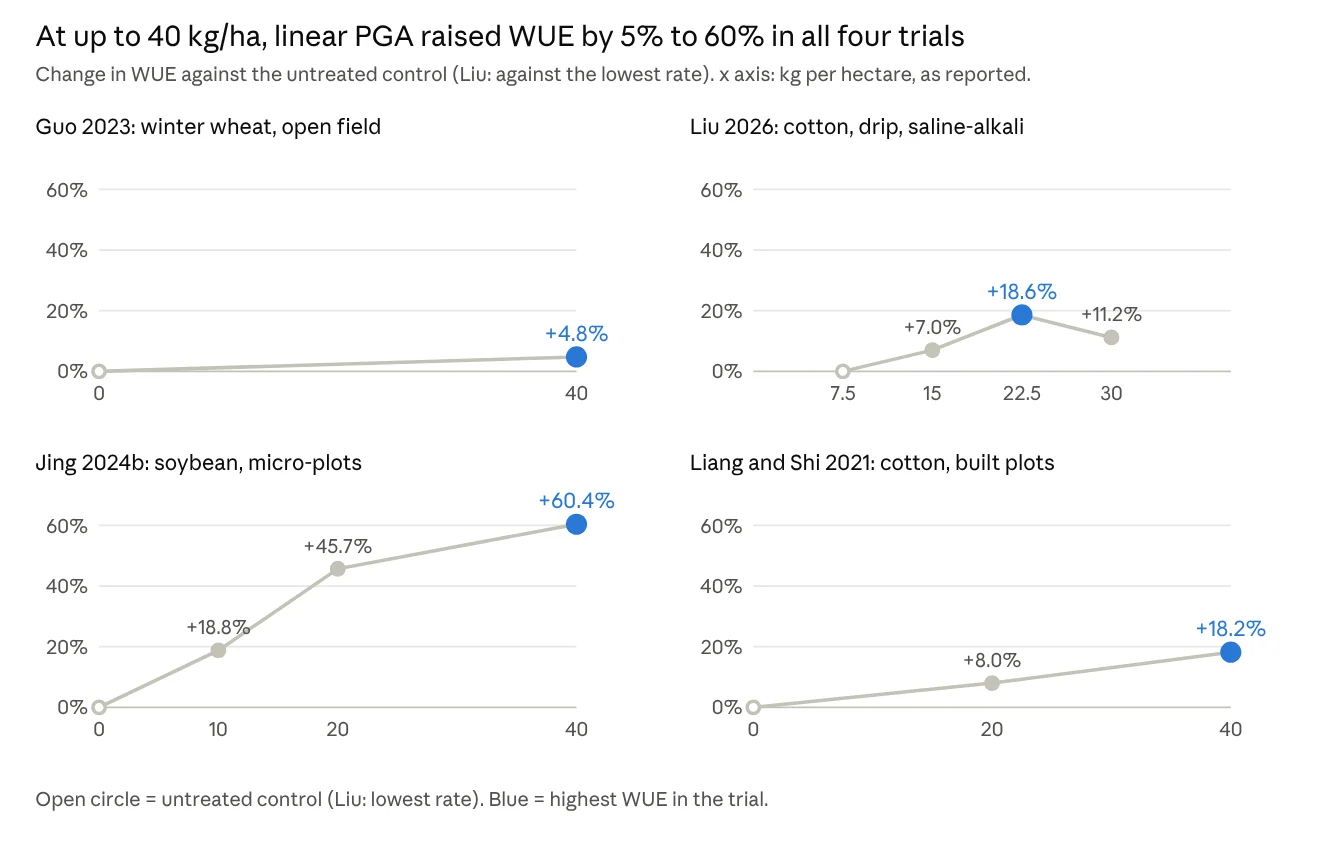
Four trials measured WUE under field or built-plot conditions. At rates up to 40 kg/ha, WUE rose in all four (Figure 3).
| Study | System | Rate (kg/ha) | WUE (kg/ha/mm) | Water use |
|---|---|---|---|---|
| Guo 2023 [10] | Wheat, field | 40 | 13.26 → 13.89 | Unchanged |
| Liu 2026 [11] | Cotton, drip, 450 mm | 7.5–30 | 10.52 → 12.48 at 22.5 | Unchanged |
| Jing 2024b [12] | Soybean plots | 10–40 | 8.79 → 10.44 / 12.81 / 14.10 | Unchanged |
| Liang and Shi [3] | Cotton plots | 20–40 | 6.75 → 7.29 / 7.98 | Lower |
Yield rose with WUE:
- Wheat [10]: 5,873 → 6,183–6,498 kg/ha
- Cotton at 450 mm [11]: 5,649 → 6,745 kg/ha
- Soybean at 10–40 kg/ha [12]: 4,065 → 4,828–6,356 kg/ha
Because water use did not change in three of the four trials, the gain was more yield per millimeter, not less water used.
Liu's trial has no untreated control, so its gains are measured against the lowest PGA rate. Smaller WUE gains were reported in Salvia pots (+3.2% to +7.3%) [14] and in mulched drip maize (+1.0% to +18.1%) [22].
4.4 Drought and water-stress tolerance
A separate body of work asks whether PGA helps plants cope with water shortage, through foliar sprays, watering, or seed priming, at doses far below the soil route. Nearly all of it is in pots, seedlings or greenhouse boxes. The table below lists what was found.
| Study | System, route | Result |
|---|---|---|
| Shan and Zhang 2024 [14] | Salvia pots, foliar | Photosynthesis +40% to +43%; WUE +3% to +7% |
| Ma 2022 [15] | Maize seedlings, 50 mg/L | Dry weight 0.96 vs 0.39 g; proline +108% |
| Wang Z 2025 [16] | Cotton seedlings, 50 mg/L | Survival 88% vs 44% |
| Yin 2018 [28] | Maize seedlings, broth | Soil water 8.3% → 9.2% |
| Wang Y 2025 [20] | Field maize, foliar | Yield +33% / +37% (1 / 2 sprays) |
| Dueñas 2024 [29] | Rice, seed priming | Better germination in susceptible varieties |
| Skalski 2024 [17] | Grassland, field | Root, biomass and resprouting responses |
At doses of tens of mg/L, PGA improved plant physiology under drought in pots and seedlings. The one openfield test, a foliar maize trial, reported yield gains of 33% to 37% [20].
5. How strong is the evidence
Ratings are this review's judgment of how consistent and how direct the evidence is.
| Claim | Studies | Rating |
|---|---|---|
| Aggregation rises | 7 [3, 4, 7, 9, 12, 25, 22] | Consistent |
| Infiltration slows | 5 [5, 6, 7, 8, 25] | Consistent |
| Saturated and field-capacity water rise | 4 [13, 4, 8, 9] | Consistent |
| Plant-available water rises | 2 tested [4, 5] | Not shown |
| Evaporation falls | 2, laboratory [4, 24] | Weak |
| WUE rises at field rates | 4 trials [10, 11, 12, 3] | Consistent |
| Plant physiology under drought | 6, pots and seedlings [14, 15, 16, 28, 29, 17] | Promising |
| Foliar PGA raises field yield | 1 [20] | Single study |
6. What the evidence does not yet show
6.1 Saturated water is not the same as available water
Saturated and field-capacity water rose in several studies, but plant-available water did not rise significantly in the two that tested it [4, 5], and one open wheat field had lower soil water [10]. How the soil effects translate into the WUE gains has not been tested directly in the field.
6.2 Dose response
Gains peaked at moderate rates in most trials, so more is not better. The highest rate did worse than a moderate one in Jing's soybean plots (+60% at 40 kg/ha, +31% at 80), Liang and Shi's cotton (peak at 80 of 160 kg/ha) and Liu's cotton (peak at 22.5 of 30 kg/ha) [12, 3, 11]. Pot studies show the same pattern at high concentrations [26, 19, 17].
6.3 Scope of the evidence
Most studies are from China, and about a third come from one research network. Dose basis and product purity are reported inconsistently, so this review states the basis for each rate. Independent field trials that measure water use and yield together would strengthen these findings.
7. Implications for water management
7.1 What the evidence supports by application route
Soil application and drip fertigation have the field-rate WUE results [3, 10, 11, 12], at 7.5 to 160 kg of product per hectare. In these trials PGA raised yield per unit of water. In Liu's cotton trial, a lower irrigation level with more PGA did not lower yield [11].
Foliar and irrigation-water dosing at tens of mg/L has physiological evidence from pots and seedlings [14, 15, 16] and one field maize result [20]. Seed priming has one study [29]. The dose is small; field-scale water-use data are still limited.
7.2 Field, greenhouse and specialty crops
The field evidence is in wheat, maize, cotton and soybean. For greenhouse and specialty crops the evidence is mostly pot-scale; Salvia is the one specialty crop tested under water stress [14].
7.3 Rate considerations
- Moderate rates did as well as or better than the highest in most trials.
- Field rates are far below pot and column rates, so pot results should not set field rates.
- State rates on a product or PGA basis, with purity.
7.4 What would settle the open questions
The most useful next step is a replicated open-field trial on sandy or sandy-loam soil that measures evapotranspiration, infiltration, soil water and yield together, with an untreated control and at least three rates from 10 to 40 kg/ha.
8. Conclusion
Linear PGA changes how soil aggregates form and how water enters and is held. In field and plot trials at up to 40 kg/ha it raised crop water use efficiency by 5% to 60%, mostly through higher yield at unchanged water use.
The soil effects are consistent across studies. The crop-level evidence is strongest for wheat, cotton and soybean, and thinner for greenhouse and specialty crops.
Independent field trials that measure soil water, evapotranspiration and yield together would confirm the link between the soil effects and the water-use gains.
Disclosure and methods
This review was prepared by Ecovia Bio, which sells products containing polyglutamic acid and has a commercial interest in the subject. It draws only on published literature. It contains no unpublished Ecovia data and no data from Ecovia products.
Studies were found by web searches of journal sites and databases, and from papers supplied by Ecovia, on polyglutamic acid and soil water, aggregation, infiltration, water use efficiency, and drought, and were read in full text where the full text was available. Each number in this review was taken from the paper cited, and percentages were recomputed from reported values where noted. The papers were rated by setting, as described in Section 1.3.
Studies of crosslinked polyglutamic acid and superabsorbent polymers are outside the scope of this review, as are cut-flower vase-solution studies, papers in Chinese-language journals, and papers with no water outcome. One 2026 paper that did not report a water outcome and several others that did not meet the scope were excluded. Background statistics on agricultural water use and drought losses come from references [1], [2] and [18].
Limits of this review: it is a narrative review, not a systematic review or a meta-analysis; searching was not exhaustive; and the product purities and several dose bases come from the papers or their suppliers and were not independently verified.
References
- FAO (2020). The State of Food and Agriculture 2020: Overcoming water challenges in agriculture. Food and Agriculture Organization of the United Nations, Rome. doi:10.4060/cb1447en
- Lesk, C., Rowhani, P., Ramankutty, N. (2016). Influence of extreme weather disasters on global crop production. Nature 529:84–87. doi:10.1038/nature16467
- Liang, J., Shi, W. (2021). Poly-γ-glutamic acid improves water-stable aggregates, nitrogen and phosphorus uptake efficiency, water-fertilizer productivity, and economic benefit in barren desertified soils of Northwest China. Agricultural Water Management 245:106551. doi:10.1016/j.agwat.2020.106551
- Shi, W., Yue, X., Liang, J., Wen, L., Li, J., Li, N., Lu, Y. (2023). Poly-γ-glutamic acid enhances the wheat yield, water use efficiency and soil physicochemical properties of the arid area in the Northwest China. Archives of Agronomy and Soil Science. doi:10.1080/03650340.2023.2170363
- Guo, J., Shi, W., Li, J., Zhai, Z. (2021). Effects of poly-γ-glutamic acid and poly-γ-glutamic acid super absorbent polymer on the sandy loam soil hydro-physical properties. PLOS ONE 16(1):e0245365. doi:10.1371/journal.pone.0245365
- Lin, Y., Wang, L., Shu, L., Chen, H., Liang, Z., Zeng, W. (2026). Effects of poly-γ-glutamic acid molecular weight on lettuce growth, soil properties, and bacterial community structure. Polymers 18(5):640. doi:10.3390/polym18050640
- Shiheng, T., Fanglan, G., Yong, X., Qingyi, S., Fugui, X., Yao, R., Juan, D., Can, C., Boyuan, X., Wei, L. (2025). Effects of γ-PGA application on soil physical and chemical properties, rhizosphere microbial community structure and metabolic function of urban abandoned land. Frontiers in Microbiology 16:1534505. doi:10.3389/fmicb.2025.1534505
- Gao, S., Zhang, X., Wang, S., Fu, Y., Li, W., Dong, Y., Li, Y., Dai, Z. (2024). Multifactorial analysis of the effect of applied gamma-polyglutamic acid on soil infiltration characteristics. Polymers 16(20):2890. doi:10.3390/polym16202890
- Jing, B., Shi, W., Wang, Y., Zhai, Z., Chen, T. (2024). Effects of poly-γ-glutamic acid on soil structure and water retention characteristics under dry-wet cycles. Soil Use and Management 40(2):e13076. doi:10.1111/sum.13076
- Guo, J., Zhang, J., Zhang, K., Li, S., Zhang, Y. (2023). Effect of γ-PGA and γ-PGA SAP on soil microenvironment and the yield of winter wheat. PLOS ONE 18(7):e0288299. doi:10.1371/journal.pone.0288299
- Liu, M., Zheng, J., Zhang, J., Yin, F., Javed, T., Wen, Y., Wang, Z. (2026). γ-polyglutamic acid-irrigation coupling strategy to improve soil quality, microbial activity, and cotton yield within arid saline-alkali fields. Agricultural Water Management 329:110361. doi:10.1016/j.agwat.2026.110361
- Jing, B., Shi, W., Wang, Y. (2024). Poly-γ-glutamic acid enhanced the yield and photosynthesis of soybeans by adjusting soil aggregates and water distribution. Journal of the Science of Food and Agriculture 104(11):6884–6892. doi:10.1002/jsfa.13520
- Liang, J., Shi, W., He, Z., Pang, L., Zhang, Y. (2019). Effects of poly-γ-glutamic acid on water use efficiency, cotton yield, and fiber quality in the sandy soil of southern Xinjiang, China. Agricultural Water Management 218:48–59. doi:10.1016/j.agwat.2019.03.009
- Shan, C., Zhang, Y. (2024). Poly-glutamic acid regulates physiological characteristics, plant growth, and the accumulation of the main medical ingredients in the root of Salvia miltiorrhiza under water shortage. Agronomy 14(12):2977. doi:10.3390/agronomy14122977
- Ma, H., Li, P., Liu, X., Li, C., Zhang, S., Wang, X., Tao, X. (2022). Poly-γ-glutamic acid enhanced the drought resistance of maize by improving photosynthesis and affecting the rhizosphere microbial community. BMC Plant Biology 22:11. doi:10.1186/s12870-021-03392-w
- Wang, Z., Zhang, X., Liusui, Y., Fu, W., Han, A., Zhao, D., Yue, J., Tu, Y., Zhang, J., Guo, Y. (2025). Unveiling the molecular mechanisms of γ-polyglutamic acid-mediated drought tolerance in cotton through transcriptomic and physiological analyses. BMC Plant Biology 25:392. doi:10.1186/s12870-025-06406-z
- Skalski, T., Zając, E., Jędrszczyk, E., Papaj, K., Kohyt, J., Góra, A., Kasprzycka, A., Shytum, D., Skowera, B., ZiernickaWojtaszek, A. (2024). Effects of γ-polyglutamic acid on grassland sandy soil properties and plant functional traits exposed to drought stress. Scientific Reports 14:3769. doi:10.1038/s41598-024-54459-1
- Howell, T.A. (2001). Enhancing water use efficiency in irrigated agriculture. Agronomy Journal 93:281–289.
- Guo, Z., Wang, J., Chen, T., Zhang, H., Hou, X., Li, J. (2024). Effects of γ-polyglutamic acid supplementation on alfalfa growth and rhizosphere soil microorganisms in sandy soil. Scientific Reports 14:6440. doi:10.1038/s41598-024-57197-6
- Wang, Y., Guo, Z., Zhang, S., Li, F., Han, Y. (2025). Foliar application of γ-polyglutamic acid enhances growth, yield, and rhizosphere microbiota of summer maize under varied water regimes. Agronomy 15(3):754. doi:10.3390/agronomy15030754
- Fu, Y., Li, G., Wang, S., Dai, Z. (2024). Effect of sesame cake fertilizer with γ-PGA on soil nutrient, water and nitrogen use efficiency. Scientific Reports 14:18669. doi:10.1038/s41598-024-69650-7
- Zhai, Z., Shi, W., Liu, L., Jing, B. (2024). Effects of poly-γ-glutamic acid on soil pore structure, maize grain filling, yield and water use efficiency under mulched drip irrigation. Field Crops Research 317:109528. doi:10.1016/j.fcr.2024.109528
- Liu, L., Shi, W., Liang, J., Yuan, Y., Hao, Q. (2023). Soil macropore characteristics and aggregate stability with poly-γglutamic acid amendment under wetting–drying cycles. European Journal of Soil Science 74(3):e13361. doi:10.1111/ejss.13361
- Liu, P., Chen, L., Hamoud, Y.A., Zheng, J., Chang, T., Ali, J., Huang, H., Shaghaleh, H. (2024). Ameliorative effect of poly-γ-glutamic acid biopreparation on coastal saline soil. Heliyon 10(17):e36762. doi:10.1016/j.heliyon.2024.e36762
- Hong, L., Wei, L., et al. (2024). Unveiling the regulatory mechanism of poly-γ-glutamic acid on soil characteristics under drought stress through integrated metagenomics and metabolomics analysis. Frontiers in Microbiology 15:1387223. doi:10.3389/fmicb.2024.1387223
- Liu, L., Shi, W. (2023). Poly-γ-glutamic acid affects NH₃ volatilization, soil nitrogen content, and soybean seedling growth. Water Supply 23(10):4242–4251. doi:10.2166/ws.2023.228
- Wang, X., Gao, J., Wu, J., Li, X., Li, J., Li, H., Wang, S. (2025). Poly-γ-glutamic production by solid-state fermentation of Bacillus natto in ammonia nitrogen movement and soil water retention processes. Enzyme and Microbial Technology 182:110543. doi:10.1016/j.enzmictec.2024.110543
- Yin, A., Jia, Y., Qiu, T., Gao, M., Cheng, S., Wang, X., et al. (2018). Poly-γ-glutamic acid improves the drought resistance of maize seedlings by adjusting the soil moisture and microbial community structure. Applied Soil Ecology 129:128–135. doi:10.1016/j.apsoil.2018.05.008
- Dueñas, C., Jr., Calvio, C., Slamet-Loedin, I.H., Susanto, U., Macovei, A. (2024). Seed priming with poly-gammaglutamic acid (γ-PGA) improves rice germination performance under drought conditions. Agriculture 14(6):926.
Download the Full Whitepaper
Explore the research behind linear polyglutamic acid and its effects on soil structure, water retention, infiltration, and crop water use efficiency.
Download the Whitepaper (PDF)