
Executive summary
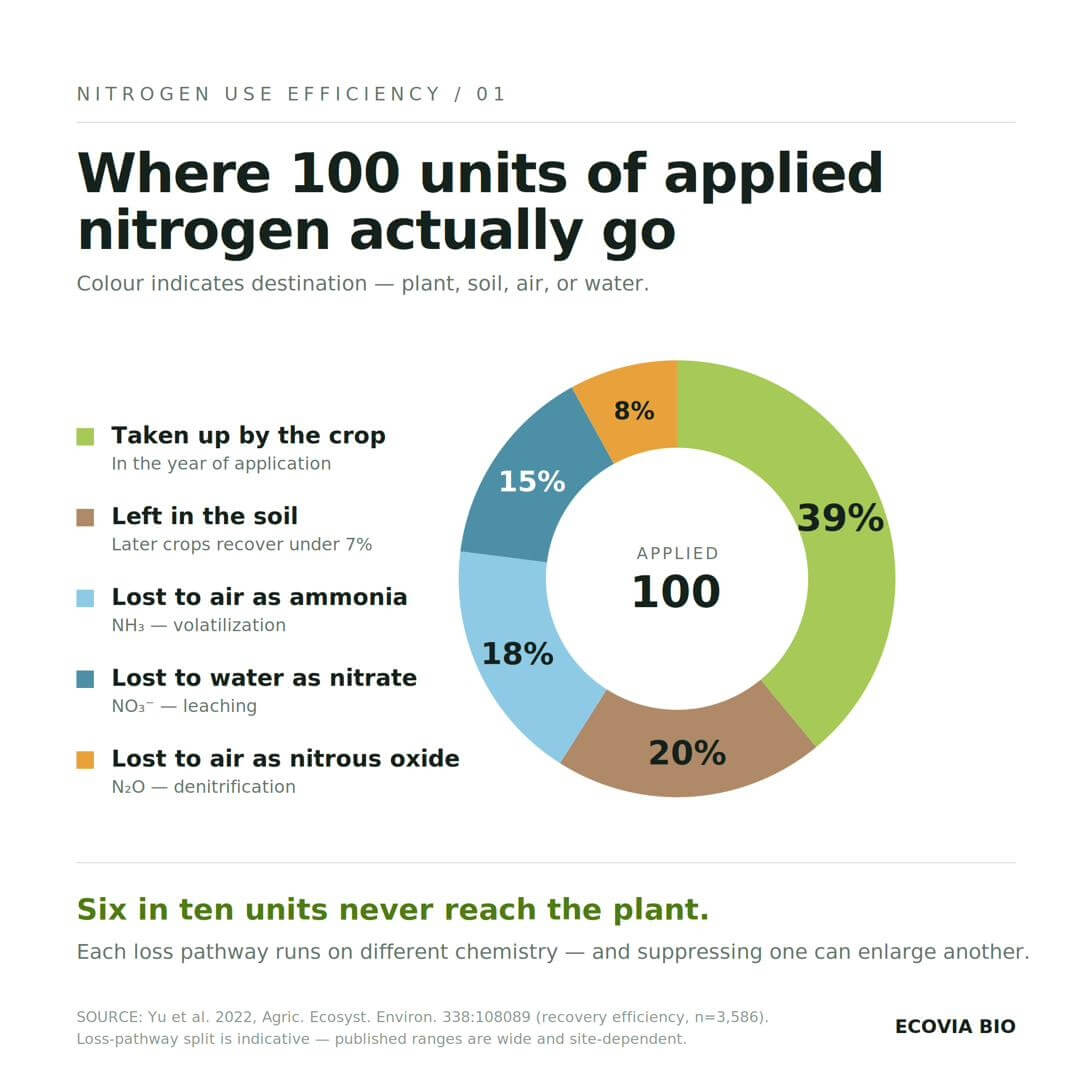
In any fertilized soil, applied nitrogen enters a cycle governed by microbial and chemical transformations that have little to do with which crop is growing above it. Urea hydrolyzes to ammonium; ammonium nitrifies to nitrate; both are taken up by roots, immobilized by microbes, or lost — to air as ammonia or nitrous oxide, to water as nitrate. Across global cereal systems, where the best large-scale accounting exists, roughly 40% of applied nitrogen is recovered by the crop in the year of application. The rest persists in the soil or leaves the system, and the same pathways operate wherever nitrogen fertilizer meets soil — a vegetable field, a greenhouse bench, a container mix.
This review looks at how one biopolymer intervenes in that cycle: poly-γ-glutamic acid, more commonly known as polyglutamic acid, or PGA. Polyglutamic acid is a water-soluble polyamino acid produced by fermentation, carrying a free carboxyl group on every residue. This review covers linear polyglutamic acid — the water-soluble form. A chemically distinct crosslinked version, sold as a superabsorbent water-retention product, is a different material with different properties, and is the subject of a separate paper in this series.
Three mechanisms are well supported in the published literature, and none of them is crop-specific. Polyglutamic acid extends the residence time of ammonium in the root zone through electrostatic association with its carboxylate backbone. It stimulates soil microbial populations, which immobilize mineral nitrogen early in a fertilization cycle and remineralize it later — shifting nitrogen availability toward the window of peak plant demand. And it promotes root development, which improves a plant’s capacity to intercept nitrogen and water before either is lost.
The evidence spans field trials in cereals, fiber crops, and leafy vegetables; greenhouse pot experiments in legumes, brassicas, and solanaceous crops; and a controlled isotope-tracing study of nitrogen partitioning at the whole-plant level. Wheat, corn, cotton, spinach, tomato, soybean, Chinese cabbage, pakchoi, and lettuce all appear in the literature reviewed here, under both open-field and greenhouse conditions. The clearest efficiency result comes from paired pot and field experiments in wheat, where nitrogen recovery efficiency rose 11.3–11.4% under field conditions and 11.8–14.0% in greenhouse pots, using purified polyglutamic acid applied at approximately 0.5 kg/ha. A separate two-year field experiment in corn reported yield gains of 4.94–21.84% alongside an 8.38–19.39% reduction in ammonia volatilization.
Like most agronomic literature, this evidence base has gaps worth knowing about: most trials were conducted in China, a few findings — soil enzyme response, and whether linear polyglutamic acid meaningfully slows soil water movement — point in different directions across studies and haven’t converged yet, and reported application rates are inconsistent across studies in ways that make direct comparison difficult. Section 6 lays these out plainly. None of them change the core picture; they’re the reason we recommend independent field validation before scaling any rate recommendation, not a reason for doubt about the underlying mechanisms.
1. The nitrogen cycle, at scale
1.1 What recovery efficiency measures
Nitrogen use efficiency is not one metric, and the distinction matters when comparing claims across crops or studies. Apparent recovery efficiency (RE_N) expresses the fraction of applied fertilizer nitrogen taken up by the plant, usually determined by difference against an unfertilized control. Agronomic efficiency (AE_N) expresses yield gain per unit of nitrogen applied. Partial factor productivity (PFP_N) expresses total yield per unit applied, without reference to a control.
These three numbers can move independently, and the literature on any given amendment routinely reports whichever metric flatters it, without specifying which was measured. Throughout this review, recovery efficiency refers to RE_N unless otherwise stated.
1.2 The numbers
The best-quantified accounting of nitrogen fate comes from global cereal systems, simply because that is where the largest datasets exist. Fertilizer nitrogen recovery by the first crop after application falls between 30 and 50% [1]. A meta-analysis drawing on 3,586 observations from 261 peer-reviewed studies placed the mean recovery efficiency across rice, wheat, and maize at 39% (95% CI 38–40%) [2]. A fifty-year global nitrogen budget found that approximately 52% of total nitrogen output was lost to the environment rather than recovered by the crop [3].
Nitrogen not recovered in the first year is largely not recovered later: residual fertilizer nitrogen is recovered by subsequent crops at rates below 7% cumulatively across as many as six successive seasons [1].
These figures describe cereal systems because that is where the accounting has been done at scale, not because the underlying loss chemistry is unique to cereals. Vegetable and specialty-crop systems are, if anything, more exposed in some respects — shorter root systems, more frequent fertigation events, and higher nitrogen rates per unit area in intensive vegetable and greenhouse production all create additional opportunity for the same three loss pathways described in Section 2.
This is also a trend rather than a constant. Global nitrogen-fertilization efficiency of cereal production — output per unit of nitrogen applied — has declined markedly since the early 1960s, even as absolute fertilizer use and cereal yields both rose sharply [4]. The intensification that raised absolute yields also lowered the proportion of applied nitrogen that reaches the plant — which means low recovery efficiency is a consequence of how fertility programs developed, not an immutable property of growing things, and is in principle addressable in any system.
1.3 What it costs
At a nitrogen rate of 180 lb N/ac and a recovery efficiency of 40%, roughly 108 lb N/ac is not taken up by the plant in the year of application. At a urea price of $500/ton — 46% N, so approximately $0.54 per lb N — that unrecovered fraction represents on the order of $58/ac in purchased nitrogen that does not reach the plant. Regional accounting supports the same order of magnitude: analysis of eight million corn fields across 30 million hectares of the US Midwest estimated annual nitrogen losses corresponding to approximately USD 485 million in fertilizer value [5].
1.4 The evidence base for polyglutamic acid: crops and systems represented
Before turning to mechanism, it is worth being explicit about where the polyglutamic acid evidence actually comes from, because it is broader than a casual read of the agronomic trade literature would suggest.
| Crop | Category | Setting | Reported outcome |
|---|---|---|---|
| Winter wheat | Cereal | Field + greenhouse pot | NUE +11.3–14.0%, yield +7.2% [25] |
| Winter wheat | Cereal | Field | Yield +7.6–14.7%, WUE +4.8–9.8% [20] |
| Corn / maize | Cereal | Field, two seasons | Yield +4.9–21.8%, NH₃ −8.4–19.4% [36] |
| Maize | Cereal | Greenhouse pot, drought stress | Improved drought resistance via root and rhizosphere microbial changes [31, 32] |
| Cotton | Fiber | Field, drip irrigation | Improved WUE, yield, fiber quality [30] |
| Soybean | Legume | Greenhouse pot | NH₃ volatilization −17.4 to −27.9% [23] |
| Tomato | Vegetable, fruiting | Pot / coating trial | Soil NH₄⁺-N +25–61%, post-harvest NO₃⁻-N −50% [22] |
| Spinach | Vegetable, leafy | Field | Yield and NUE improved, economic optimum at 0.10% [33] |
| Chinese cabbage | Vegetable, leafy | Greenhouse pot | 30% N-rate cut + polyglutamic acid matched or beat full-rate fertilization, yield +20.2 to +37.6% over N-only [27] |
| Pakchoi | Vegetable, leafy | Controlled plant–soil system, isotope-traced | Root biomass and activity increased; direct N contribution quantified at 5.6% [29] |
| Lettuce | Vegetable, leafy | Greenhouse pot, molecular weight comparison | Growth scaled with molecular weight, inhibited at excess; infiltration cut 22–90% [21] |
| Rice | Cereal | Column, ¹⁵N-traced coating | NH₃ −65.7 to −82.9%; N₂O not significantly reduced [35] |
| Desertified rangeland soil | Soil remediation | Field | Improved water-stable aggregates, N and P uptake efficiency [34] |
Two things follow from this table. First, the mechanisms described in Section 4 are not a cereal-specific story tested elsewhere as an afterthought — leafy vegetables, fruiting vegetables, a legume, a fiber crop, and degraded rangeland soil all appear here, under both field and greenhouse conditions. Second, greenhouse pot systems are not a lesser form of evidence; they are where much of the mechanistic clarity in this literature comes from, since pot systems allow rate, soil type, and nitrogen source to be controlled in ways open-field trials cannot. The field trials in wheat, corn, cotton, and spinach then provide validation under real weather and soil heterogeneity. Reading the two types of evidence together, rather than treating pot studies as merely preliminary, is the right way to use this literature.
2. The nitrogen cycle’s three exit routes
This section describes soil nitrogen chemistry that applies wherever nitrogen fertilizer meets soil — a field, a raised bed, a container mix, a greenhouse bench. None of it is specific to any one crop.
2.1 Ammonia volatilization
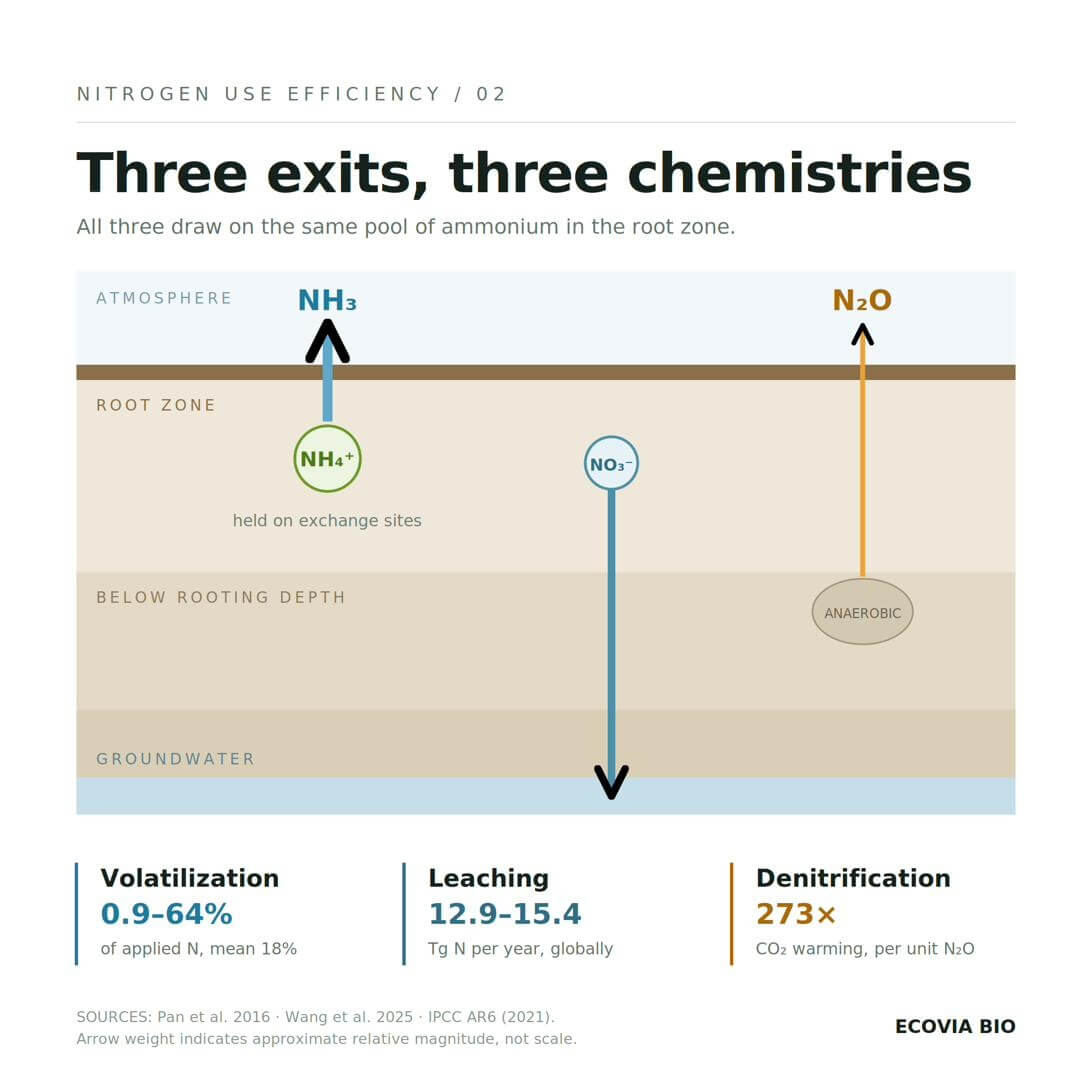
When urea is applied to soil, the enzyme urease — abundant in soil and in plant residue — hydrolyses it to ammonium carbonate, which decomposes to carbon dioxide and ammonia. The nitrogen then sits at an equilibrium between ammonium ion (NH₄⁺), which is retained on the soil cation exchange complex, and dissolved ammonia (NH₃), which is volatile. That equilibrium is pH-dependent, and the hydrolysis reaction itself raises pH in the immediate vicinity of the granule, pushing the equilibrium toward the gaseous form.
The conditions that favor loss are well characterized: surface application without incorporation, high soil pH, low cation exchange capacity, surface residue that intercepts granules and concentrates urease activity, warm temperatures, and wind. None of these conditions are exclusive to any cropping system.
The magnitude is substantial and highly variable. A global synthesis of 824 observations found losses ranging from 0.9 to 64% of applied nitrogen as ammonia, averaging 18% [6]. A separate meta-analysis reported a range of 2.9 to 40% with a mean of 31% [7]. The spread across these two syntheses is itself informative — ammonia loss is dominated by site and management conditions rather than by any single controllable variable, which is why generalized loss factors perform poorly at any individual site.
The same global synthesis quantified the effectiveness of existing mitigations, and one result deserves particular attention. Urease inhibitors reduced ammonia volatilization by 54%, and controlled-release fertilizers by 68%. Nitrification inhibitors, however, increased ammonia volatilization by 38% [6].
That last figure is a useful demonstration that the three loss pathways are coupled. A nitrification inhibitor works by slowing the oxidation of ammonium to nitrate, which reduces nitrate available for leaching and denitrification. But the ammonium that is not oxidized remains ammonium, sustaining a larger pool subject to the volatilization equilibrium. The intervention succeeds at its stated objective and shifts loss into a different pathway.
This has a direct implication for how efficiency amendments should be evaluated. A mechanism that acts on the residence time and availability of ammonium — rather than on the activity of a single enzyme in a single transformation — has a structural advantage, because it does not simply relocate nitrogen from one loss route to another.
2.2 Nitrate leaching
Nitrification converts ammonium to nitrate through the sequential activity of ammonia-oxidizing archaea and bacteria and nitrite-oxidizing bacteria. The consequence for retention is fundamental: ammonium carries positive charge and is held on the predominantly negatively charged soil exchange complex, while nitrate carries negative charge and is not. Nitrate moves with soil water.
Leaching loss is therefore a function of three things — the rate at which nitrate is formed, the volume and timing of drainage or irrigation, and the degree of mismatch between when nitrate is present and when the plant can take it up. The third factor explains why loss is often concentrated in early-cycle and post-harvest windows, when nitrate is abundant and root demand is low. It also identifies the intervention point that matters most: not simply retaining more nitrogen, but retaining it until the plant is ready to use it.
Recent global estimation places cropland nitrate leaching from synthetic nitrogen at 12.9 to 15.4 Tg N per year, with leaching factors varying by an order of magnitude across regions and crops, driven primarily by hydroclimatic and edaphic conditions rather than by fertilizer management. Maize, wheat, rice, and vegetables together account for close to half of the global total [8].
The downstream consequence in North America is well documented. Agricultural sources contribute roughly 60% of the nitrogen delivered to the Gulf of Mexico [9], and so much nitrogen has already accumulated in the Mississippi River basin that even eliminating future agricultural nitrogen inputs would take approximately 30 years to resolve existing loading [10]. Source-side efficiency amendments reduce new loading, but they don’t undo a stock already in transit.
2.3 Denitrification and nitrous oxide
Under low-oxygen conditions — saturated soils, compacted zones, the interiors of aggregates, an overwatered container — denitrifying organisms use nitrate as a terminal electron acceptor, reducing it stepwise to nitrogen gas. Nitrous oxide (N₂O) is an obligate intermediate in that sequence, and incomplete reduction releases it to the atmosphere. Nitrification contributes additional N₂O as a byproduct of ammonia oxidation.
By mass, this is the smallest of the three pathways. The IPCC Tier 1 direct emission factor for nitrogen applied to soils is 1% of applied nitrogen, with the 2019 refinement narrowing the uncertainty range to 0.1–1.8% [11]. Two considerations make that small percentage disproportionately important. First, potency: nitrous oxide has a 100- year global warming potential of 273 times carbon dioxide [12], and agricultural activities contribute almost half of total anthropogenic N₂O emissions, with global cropland N₂O emissions quadrupling to 1.2 Tg N₂O-N per year over 1961–2020 [13]. Second, nonlinearity: N₂O emissions respond exponentially rather than linearly to nitrogen input rate, contrary to the linear assumption embedded in IPCC Tier 1 methodology [14]. The marginal unit of nitrogen — the insurance application made against an uncertain outcome — carries a disproportionate emissions cost relative to the base rate.
This exponential relationship is a strong argument for efficiency amendments as a class: if emissions scale super- proportionally with rate, any intervention permitting a reduced application rate while maintaining plant-available nitrogen delivers climate benefit greater than the proportional rate reduction alone would suggest.
3. What polyglutamic acid is
3.1 Structure and origin
Polyglutamic acid — more formally poly-γ-glutamic acid — is a polyamino acid: a polymer of glutamic acid residues, occurring as both D- and L-enantiomers, linked through γ-amide bonds between the α-amino group of one residue and the γ-carboxyl group of the next [15, 16].
That linkage is the structurally defining feature and distinguishes polyglutamic acid from proteins, which are linked through α-peptide bonds. Because the backbone bond is not the standard peptide bond, polyglutamic acid resists degradation by common proteases and persists in soil longer than a protein of equivalent size would. It is nonetheless fully biodegradable, broken down by soil microorganisms and enzymes to shorter-chain polyglutamic acid and ultimately to glutamic acid monomers [17] — a property that holds in field soil, potting substrate, or container media alike.
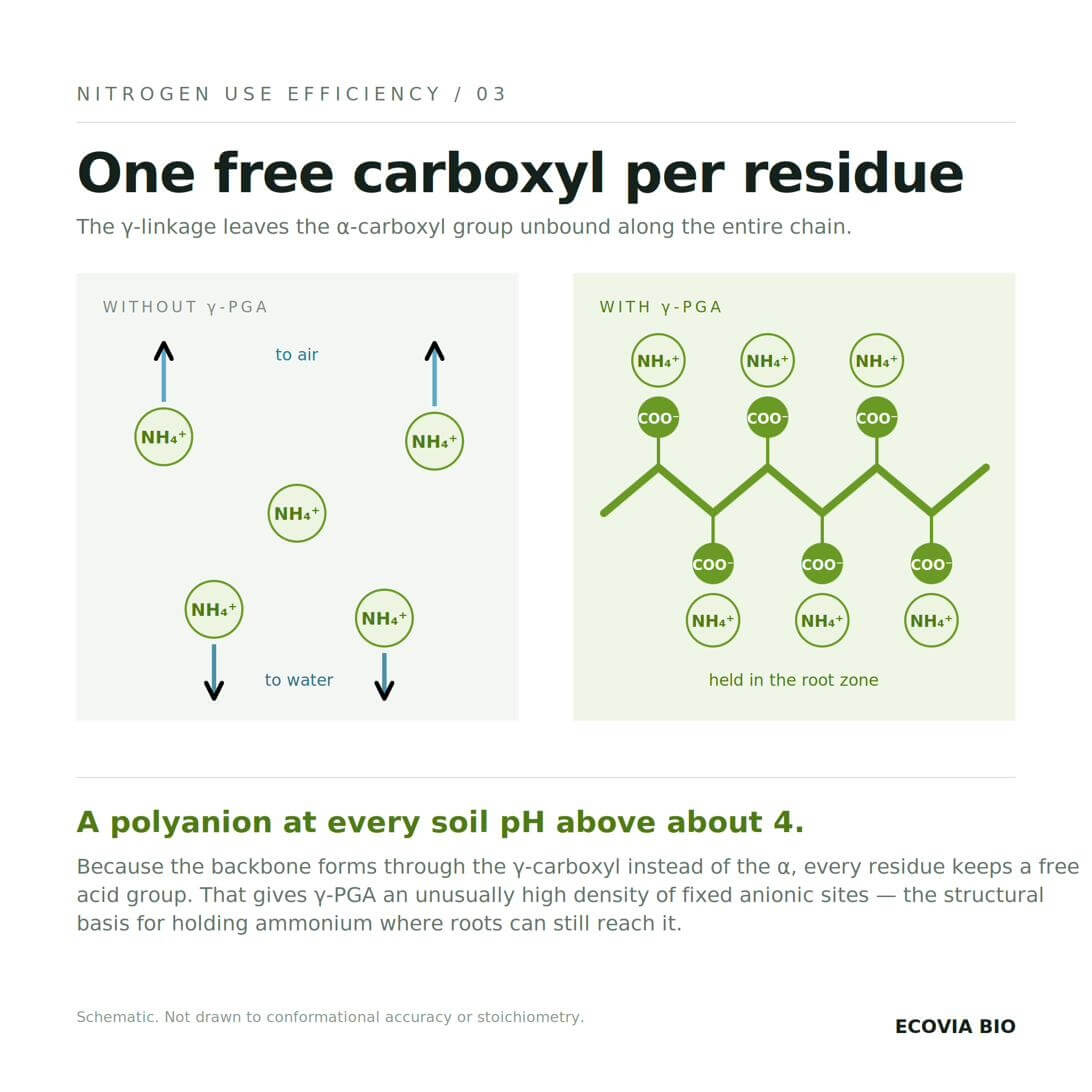
The linkage has a second consequence that matters more for how it interacts with the nitrogen cycle. In a conventional protein, the α-carboxyl group is consumed in forming the backbone. In polyglutamic acid, the backbone consumes the γ-carboxyl, leaving the α-carboxyl group free and pendant on every single residue. The result is a polymer with an exceptionally high density of ionizable carboxyl groups — a polyanion at any pH above roughly 4, which includes essentially all agricultural and horticultural growing media.
Polyglutamic acid is produced by fermentation, principally by Bacillus subtilis and Bacillus licheniformis. Reported molecular weights span 10 to 10,000 kDa depending on strain, medium, and process control [18], and engineered strains can now be directed toward specific molecular weight ranges [19]. It occurs naturally in food: the characteristic viscous texture of natto, fermented soybean, is attributable to polyglutamic acid produced by B. subtilis during fermentation.
3.2 Linear polyglutamic acid, not the superabsorbent form
This review covers linear polyglutamic acid — the water-soluble form. It dissolves into the soil solution, where it functions as a dissolved polyanion and as a substrate for soil microorganisms. A chemically different material also appears in the commercial literature: polyglutamic acid that has been crosslinked into an insoluble, three- dimensional network, which behaves as a superabsorbent polymer (SAP) capable of holding hundreds of times its weight in water. Absorption figures in the hundreds or thousands of grams per gram, which circulate widely in commercial literature, generally refer to this crosslinked form. We cover crosslinked polyglutamic acid in more depth in a separate paper in this series.
That said, this review’s own evidence base does not support treating linear polyglutamic acid as having no effect on soil water, and the contradiction is worth stating plainly rather than smoothing over.
In one full-season wheat field trial, soil water content under linear polyglutamic acid was unchanged or slightly lower than untreated controls, attributed to the larger root systems it promotes (Section 4.3) drawing more water from the profile [20]. Water use efficiency nonetheless improved — by 4.8–9.8% — through yield gained per unit of water, not water held in soil.
Against that, a separate pot and soil-column study using linear polyglutamic acid (92% purity, not crosslinked) across three molecular weight classes found the opposite pattern: cumulative soil-water infiltration fell by 22% to 90% relative to untreated soil, with the reduction scaling with both molecular weight and application rate, and soil ammonium-nitrogen content rising by up to 161% under the highest molecular weight treatment [21]. The authors attribute this to increased solution viscosity slowing water movement through the profile — a genuine water- retention effect, not merely a root-driven artifact, and not dependent on crosslinking.
These two findings cannot both be the full picture. Plausible explanations include soil texture (clay loam versus the sandy soil used in the infiltration study), the specific molecular weight tested, or genuine differences in what was measured — bulk soil water content over a season versus infiltration rate over minutes to hours. What can be said is that water effects for linear polyglutamic acid appear to be molecular-weight- and context-dependent rather than absent, and any claim made about water behavior should specify which molecular weight and soil type it applies to.
3.3 Molecular weight is a functional specification
Molecular weight is not a minor manufacturing detail. Trials comparing polyglutamic acid of low (70–100 kDa), high (700–1,100 kDa), and ultra-high (>3,000 kDa) molecular weight on greenhouse-grown lettuce found that at a 0.1% application rate, blade length and width increased with increasing molecular weight — but that excessive application of the ultra-high molecular weight material inhibited growth [21].
The response to polyglutamic acid is therefore a function of at least two independent specifications, molecular weight and application rate, interacting with soil or substrate type. Many published trials, across every crop in this review, do not report molecular weight at all — a gap worth closing when comparing products or studies.
4. Mechanisms and the evidence across cropping systems
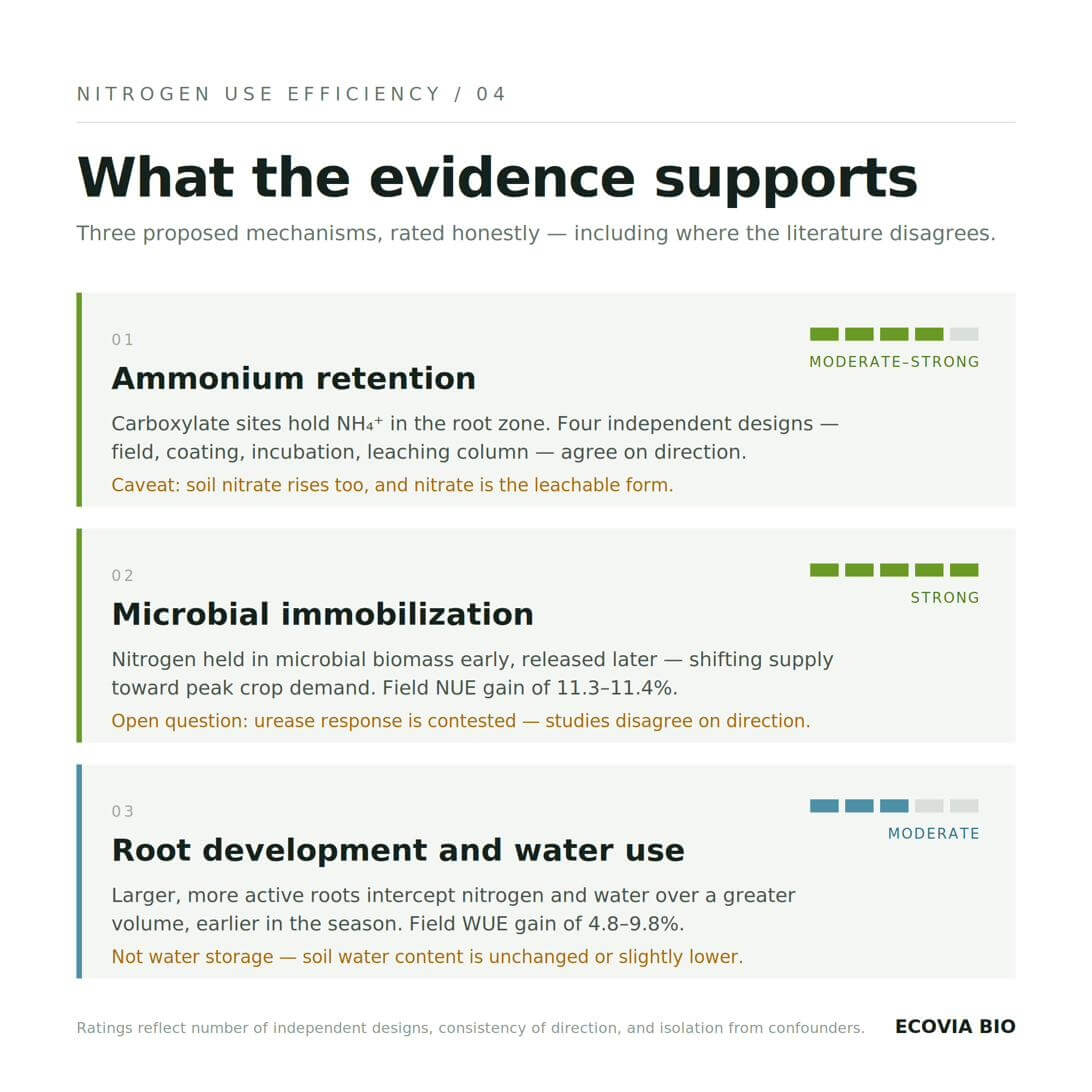
Three mechanisms explain how polyglutamic acid interacts with the soil nitrogen cycle. They are not mutually exclusive, most published designs cannot separate them, and — as Section 1.4 established — the evidence for each is drawn from a genuinely mixed set of crops and systems rather than from cereals alone. Each is presented below with an assessment of how strong the supporting evidence is.
4.1 Ammonium retention through carboxylate binding
Evidence: moderate to strong. Multiple independent study designs, across different crops and systems, point the same direction, and the explanation is mechanistically straightforward.
A polymer presenting a free carboxyl group on every residue carries high anionic charge density in the soil solution. Ammonium cations associate electrostatically with those fixed anionic sites, extending the time ammonium remains in the root zone in a form available for plant uptake rather than for volatilization or nitrification.
Four studies, in four different crops and four different experimental designs, support this:
Field trial, wheat. Average soil ammonium-nitrogen content across the growing season increased by 8.7%, 21.0%, 31.2%, and 38.2% at increasing polyglutamic acid rates [20].
Coating trial, tomato. Polyglutamic acid applied as a urea coating produced soil ammonium-nitrogen concentrations 25–61% higher than urea-only controls throughout the growing period, in a greenhouse pot system. Nitrate-nitrogen was nearly 50% lower after harvest. All three coating formulations tested met the dissolution rate standards recommended by the Committee of European Normalization [22].
Volatilization incubation, soybean. In a 35-day greenhouse incubation, cumulative ammonia volatilization from sandy loam soil decreased by 17.4%, 22.9%, and 26.9% at increasing polyglutamic acid application rates. Soil nitrogen content increased 17–63% in sandy soil and 7–33% in sandy loam [23].
Leaching column, generalized soil study. Applied alongside urea, polyglutamic acid reduced cumulative ammonium loss by 17.8–29.3% and nitrate loss by 8.3–52.4% across eight simulated rainfall events. Cumulative total dissolved nitrogen loss fell by 7.2–40.1% [24].
The value of these results lies less in any individual figure than in their independence. A field cereal trial, a greenhouse vegetable coating trial, a legume incubation, and a leaching column measure different things, in different crops, under different conditions, and they agree on direction.
Worth noting: the wheat field trial also found soil nitrate content increased, by 11.3–26.3% across the same rate range [20]. That’s not automatically a benefit, since nitrate is also the leachable form — whether it helps depends on whether it’s present when the plant can use it, which is the subject of the next mechanism.
4.2 Microbial immobilization and delayed remineralization
Evidence: strong for the effect, moderate for the timing mechanism. This is the mechanism most specific to polyglutamic acid, and arguably the most crop-general of the three, since it operates through soil microbiology rather than crop physiology.
Polyglutamic acid is a carbon and nitrogen substrate for soil microorganisms, and the microbial response to application is large wherever it has been measured. In the wheat field trial, soil bacterial counts at maturity increased by 151% to 698% and actinomycete counts by 564% to 3,271% across the rate range tested. Enzyme activities rose correspondingly [20]. A greenhouse pot study in Chinese cabbage tested purified polyglutamic acid, live B. subtilis A-5, and a fermentation broth containing both, each alongside a 30% cut to the nitrogen rate. All three treatments beat the nitrogen-reduction-only control by 20.2–37.6% on yield, and each matched or exceeded the yield of full-rate conventional fertilization [27] — a substantially stronger result than “maintained performance,” and a vegetable-system parallel to the field-cereal finding above.
That microbial bloom has a direct consequence for nitrogen timing. Paired greenhouse pot and field experiments in wheat found that following polyglutamic acid application, mineral nitrogen was immobilized into microbial biomass during the early growth stage, then gradually released as the season progressed [25].
This addresses the timing-mismatch problem from Section 2.2 more directly than simple retention does. Early-cycle nitrate is the fraction most vulnerable to leaching, because drainage or irrigation is high and root demand is low. Nitrogen held in microbial biomass during that window isn’t leachable. Remineralization later delivers it when uptake capacity is greatest.
The same wheat study reported the clearest efficiency measurement available in this literature: nitrogen recovery efficiency increased by 11.8–14.0% in greenhouse pot experiments and 11.3–11.4% in field experiments, with the highest field grain yield 7.2% above the urea control [25]. A separate study confirmed polyglutamic acid’s effects on soil microbial community composition and nitrogen pools [26].
One inconsistency worth flagging: the wheat field trial found soil urease activity increased substantially under polyglutamic acid treatment — by 41% to 239% across the rate range [20]. A separate study of nitrogen functional genes found that polyglutamic acid applied with urea inhibited urease activity instead, and differentially altered the abundance of genes governing urea hydrolysis (ureC), nitrification (archaeal and bacterial amoA), and denitrification (narG, nirK, qnorB, nosZ) [28]. These two findings point in opposite directions — the studies differ in soil type, nitrogen source, application rate, and measurement timing, and the discrepancy isn’t resolved yet. We’d treat any claim that polyglutamic acid acts as a urease inhibitor as unproven until this settles.
4.3 Root development and water use efficiency
Evidence: moderate to strong.
As established in Section 3.2, polyglutamic acid does not increase soil water content — what it appears to do, across a wide range of crops, is increase the plant’s capacity to acquire water and nutrients through root system development.
Isotope tracer work in a controlled plant–soil system found that polyglutamic acid application increased both root biomass and root activity in pakchoi, a leafy vegetable, alongside altered carbon and nitrogen metabolism — higher soluble sugar content, lower nitrate and free amino acid content [29]. Field and greenhouse pot studies across a wide range of crops report consistent downstream effects:
- Winter wheat, field, clay loam: water use efficiency increased 4.8–9.8%; panicle number increased 11.9–19.5%; grain yield increased 7.6–14.7% [20].
- Cotton, field, film drip irrigation, sandy soil: improved water use efficiency, yield, and fiber quality, with the optimum at 80 kg/ha [30].
- Corn, field, mulched drip irrigation, two seasons: yield increased 4.94–21.84%, ammonia volatilization fell 8.38–19.39%, soil mineral nitrogen accumulation rose with application rate [36].
- Maize, greenhouse pot, drought stress: improved drought resistance attributed to adjusted soil moisture dynamics and microbial community structure [31]; a separate study attributed improved drought resistance to enhanced photosynthesis and rhizosphere community changes [32].
- Spinach, field: increased fresh weight and dry matter yield with improved nitrogen fertilizer utilization efficiency, economic optimum at 0.10% [33].
- Desertified rangeland soil, field: improved water-stable aggregates, nitrogen and phosphorus uptake efficiency, and water–fertilizer productivity — a non-crop-specific soil remediation context [34].
The relationship between mechanisms is worth making explicit, and it holds regardless of which of these crops or systems is under consideration. A larger, more active root system intercepts nitrogen over a greater soil volume and does so earlier. That reduces the pool of nitrogen left unclaimed in the profile, which is the pool at risk of loss. Root development isn’t a separate benefit sitting alongside nitrogen retention — it’s part of the same nitrogen- cycle story, expressed through plant physiology rather than soil chemistry.
5. Dose response and the optimum
Every reviewed study that tested multiple application rates found either an optimum or clearly diminishing returns, and this pattern holds across every crop and system tested — field and greenhouse alike.
In a greenhouse soybean seedling trial, maximum total dry weight occurred at 0.3% w/w in sandy soil and 0.1% w/w in sandy loam. At 0.5% w/w, dry weight fell below the untreated control in both soil types [23]. In a greenhouse lettuce molecular weight trial, ultra-high molecular weight polyglutamic acid inhibited growth at elevated application rates [21]. In the wheat field trial, yield continued to increase up to 160 kg/ha, but the rate of increase fell off above 80 kg/ha [20]. Similar inflections appear in cotton at 80 kg/ha [30], spinach at 0.10% [33], and a two- year corn field experiment placing the optimal strategy at 70 kg/ha [36].
These figures cannot be compared across studies, and none should be read as a pure-polymer rate for any crop. The literature reports polyglutamic acid dose on at least four different bases: mass of product per hectare, percent of soil mass, grams per kilogram of soil, and percent of the fertilizer being amended. Studies reporting kg/ha generally use commercial agricultural-grade polyglutamic acid, which is sold at assays between 10% and 29% active polymer, and few state the assay — worth keeping in mind when comparing rates across the crop table above.
The one study in this review that specifies both a purified material and an unambiguous basis is the paired greenhouse pot and field wheat experiment [25]. It applied purified polyglutamic acid at 0.10% of the urea mass, with urea broadcast at 225 kg N/ha — approximately 0.5 kg/ha of purified polyglutamic acid. That’s well below the kg/ha figures reported for other crops above, and it produced the largest nitrogen recovery gain in this review. Until the dose basis of each study is resolved, no rate recommendation should be drawn directly from this literature without confirming what the source material actually was. Section 7 states what can be said in the meantime.
The explanation offered for outright inhibition at very high rates is hydraulic, and applies in both field soil and greenhouse substrate: polyglutamic acid in solution increases viscosity and, at sufficient concentration, reduces air- filled porosity, restricting root respiration and growth. The mechanism that produces benefit at moderate rates produces harm at high ones.
A second finding is worth keeping in mind. In the soybean work, quadratic fits to soil mineral nitrogen concentration identified maxima at polyglutamic acid rates of 0.44% in sandy soil and 0.35% in sandy loam — but the rates producing maximum plant growth were considerably lower, at 0.3% and 0.1% respectively [23]. Maximizing retained soil nitrogen is not the same as maximizing plant performance. Any application rate derived solely from soil chemistry endpoints will overshoot the agronomic optimum. Soil texture is the strongest single determinant across the studies reviewed, with coarser soils tolerating and benefiting from higher rates than finer-textured soils.
6. What the evidence does not yet establish
The following are worth knowing before drawing firm conclusions from this literature — not reasons to doubt the core mechanisms, but useful context on where more work would help.
Geographic concentration. Most polyglutamic acid studies, across cereals, vegetables, fiber crops, and soil remediation contexts alike, were conducted in China — principally Shaanxi, Shanxi, Xinjiang, Jiangsu, and Shandong. Independent field validation in other soils and climates, including North America, would strengthen confidence in transferability.
Study scale and system type. Full-season field trials exist in wheat, corn, cotton, and spinach, but much of the mechanistic evidence — including the isotope-tracing and dose-response work — comes from greenhouse pot experiments. That’s not purely a weakness: pot systems are where rate, soil type, and nitrogen source can be controlled cleanly enough to isolate mechanism, which field trials generally can’t do. But more replicated multi-site field trials, and more systematic pot-to-field comparison, would help confirm how well findings transfer.
Application rates are reported on inconsistent bases. Doses in the literature appear as percent of soil mass, grams per kilogram of soil, percent of the amended fertilizer, and kilograms of product per hectare, and most studies don’t state whether the material was purified polyglutamic acid or commercial agricultural grade (sold at 10–30% active polymer). Converted to a common basis, the spread is large — a rate of 0.1% w/w soil corresponds to roughly 1,300–2,600 kg/ha depending on incorporation depth, while the purified-material wheat study [25] applied approximately 0.5 kg/ha. Normalizing dose across studies would make the existing literature considerably more useful.
Mechanism attribution. Ionic binding, microbial immobilization, and root development are confounded in nearly all published designs. Few studies isolate them, so the relative contribution of each to observed nitrogen retention isn’t yet clear.
The enzyme response needs settling. As noted in Section 4.2, published findings on polyglutamic acid’s effect on soil urease activity point in opposite directions. Resolving this would clarify whether polyglutamic acid reduces or increases volatilization risk under surface-applied urea.
So does the water-retention response. As detailed in Section 3.2, one field trial found linear polyglutamic acid had no water-storage effect, while a separate pot and soil-column study found substantial infiltration reduction that scaled with molecular weight and rate. Both used genuinely linear, non-crosslinked material. Soil texture and molecular weight are plausible explanations for the difference, but neither has been tested directly against the other in a single study.
Molecular weight reporting. Many publications don’t report the molecular weight of the polyglutamic acid used, which limits cross-study comparison given the documented molecular weight dependence of plant response.
Nitrous oxide. No study has measured N₂O flux under linear polyglutamic acid applied directly to soil. One ¹⁵N- traced study of a polyglutamic acid-based urea coating in rice did measure it, and found that while emission rate fell between days 7 and 27, total fertilizer-derived N₂O emission across the full growing period was not significantly reduced [35]. Ammonia volatilization in the same study fell by 65.7–82.9%, and leaching accounted for 51–70% of the total loss reduction — so the benefit was real, just concentrated in the other two pathways. A reasonable climate argument for polyglutamic acid rests on reduced nitrogen rate, which the exponential rate-response relationship in Section 2.3 supports, rather than on a direct emissions reduction that hasn’t been demonstrated.
Crop-type coverage. The crops in Section 1.4 span cereals, several vegetable types, a fiber crop, a legume, and degraded soil — a genuinely useful range. Perennial fruit and tree crops, turfgrass, ornamentals, and soilless or hydroponic systems remain largely untested, and the ammonium-exchange mechanism in Section 4.1 may work differently without a soil cation exchange complex to work with.
7. Implications for nitrogen management
Given the state of the evidence, the following are supportable across the crops and systems this review covers — field or greenhouse, cereal, vegetable, or fiber crop:
Don’t assume water behavior without checking molecular weight and soil type. The evidence on linear polyglutamic acid and soil water is genuinely mixed — one field trial found no water-storage benefit, while a separate study found substantial infiltration reduction at higher molecular weights. Treat water-retention claims skeptically until the molecular weight and soil texture are specified, and evaluate primarily on yield and nitrogen recovery, which show more consistent benefit across studies.
Treat published rates as non-comparable until the basis is stated. Reported polyglutamic acid doses span several different units, and kg/ha figures generally describe commercial product at 10–30% assay rather than pure polymer. The one study using purified material at a stated basis achieved its nitrogen recovery gain at roughly 0.5 kg/ha of purified polyglutamic acid. Ask any supplier quoting a rate whether it’s product or active polymer, and at what assay.
Match the rate to the soil or substrate texture. Coarse-textured soils and substrates tolerate and benefit from higher application rates than finer-textured ones. Rate recommendations transferred between soil types, or between field and container systems, without adjustment are likely to need correction.
Target the systems where the loss pathway is largest. Expected value is highest where a specific loss mechanism dominates: coarse-textured soils under high rainfall or heavy irrigation with early-cycle nitrogen (leaching), and systems where the gap between nitrogen availability and plant demand is widest.
Justify any rate reduction on demonstrated efficiency, not on assumption. Polyglutamic acid is an efficiency enhancer, not a nitrogen source. Where nitrogen rates are reduced, base the reduction on measured recovery-efficiency gain — there’s field precedent at around 11% — rather than on the presence of the product alone.
Specify molecular weight. Molecular weight is a functional specification that materially affects performance, and it’s not consistently disclosed in the market. Request it on any technical data sheet, and treat an absorption figure quoted without its test medium as uninformative for the linear form.
Expect an optimum, not a straight dose-response curve. More is not better, in field soil or greenhouse substrate alike. Over-application has been shown to reduce plant performance below untreated controls.
8. Conclusion
The three principal pathways by which fertilizer nitrogen is lost — volatilization, leaching, and denitrification — differ in chemistry, in the conditions that drive them, and in the interventions that address them. But they operate the same way wherever nitrogen fertilizer meets a growing medium, and they share a common upstream determinant: whether nitrogen is intercepted by the plant before it can be lost. That’s as true in a greenhouse vegetable bench as in a broadacre cereal field.
Polyglutamic acid acts on that determinant through several routes at once. With a free carboxyl group on every backbone residue, it extends ammonium residence time in the root zone. As a microbial substrate, it shifts nitrogen into biomass during the early window when leaching risk is highest and plant demand is lowest, releasing it later as demand rises. And by promoting root development, it increases the volume of soil from which a plant can recover nitrogen and water. The evidence for this comes from cereals, vegetables, a fiber crop, a legume, and degraded soil, under both field and greenhouse conditions — not from any single cropping system. Field measurement of the combined effect places nitrogen recovery efficiency gains around 11%, with yield gains of 7% or more in the best- characterized case.
Two clarifications are worth carrying forward. This review covers linear, water-soluble polyglutamic acid — not the crosslinked superabsorbent form, which behaves differently and is covered separately. And the urease question and the nitrous oxide question both remain open; Section 6 lays out why, and what would resolve them.
The mechanism is well-supported and appears to generalize across the range of crops and systems tested so far. Independent field validation, particularly outside China, would round out the picture — and that’s exactly the kind of work worth prioritizing next, rather than a reason to hold back on what the evidence already shows.
For anyone managing nitrogen — in a field, a greenhouse, or a container system — the practical next question is whether this works at commercially viable rates, in a given soil or substrate, under a given management regime. That’s answerable, and answering it well means running exactly the kind of multi-site, cross-system field and greenhouse trials this series will keep pointing toward.
If biopolymer chemistry is to be delivered through fertilizer coatings, the choice of polymer now carries regulatory weight alongside agronomic weight. Coated fertilizers have historically relied on synthetic polymers that persist in soil after nutrient release, and that persistence has come under direct regulatory scrutiny. That’s the subject of the next paper in this series.
Disclosure and methods
Ecovia Bio produces linear polyglutamic acid by microbial fermentation and has a commercial interest in its application across agricultural and horticultural markets.
This review was compiled entirely from published literature spanning multiple crop types and both field and greenhouse settings. No Ecovia Bio data are included. Studies were identified through database searching without restriction on outcome direction, crop type, or system, and findings that complicate the general picture are reported where identified — including documented cases of polyglutamic acid over-application reducing performance below untreated controls, the finding that soil water content declines slightly under linear polyglutamic acid application, and the open question around soil urease response.
Where a claim commonly made in commercial literature could not be substantiated against a primary source, it has been excluded rather than repeated.
References
- Ladha, J.K., Pathak, H., Krupnik, T.J., Six, J., van Kessel, C. (2005). Efficiency of fertilizer nitrogen in cereal production: retrospects and prospects. Advances in Agronomy 87:85–156.
- Yu, X., Keitel, C., Zhang, Y., Wangeci, A.N., Dijkstra, F.A. (2022). Global meta-analysis of nitrogen fertilizer use efficiency in rice, wheat and maize. Agriculture, Ecosystems & Environment 338:108089. doi:10.1016/j.agee.2022.108089
- Ladha, J.K., Tirol-Padre, A., Reddy, C.K., et al. (2016). Global nitrogen budgets in cereals: A 50-year assessment for maize, rice and wheat production systems. Scientific Reports 6:19355.
- Tilman, D., Cassman, K.G., Matson, P.A., Naylor, R., Polasky, S. (2002). Agricultural sustainability and intensive production practices. Nature 418:671–677.
- Basso, B., Shuai, G., Zhang, J., Robertson, G.P. (2019). Yield stability analysis reveals sources of large-scale nitrogen loss from the US Midwest. Scientific Reports 9:5774. doi:10.1038/s41598-019-42271-1
- Pan, B., Lam, S.K., Mosier, A., Luo, Y., Chen, D. (2016). Ammonia volatilization from synthetic fertilizers and its mitigation strategies: A global synthesis. Agriculture, Ecosystems & Environment 232:283–289.
- Silva, A.G.B., Sequeira, C.H., Sermarini, R.A., Otto, R. (2017). Urease inhibitor NBPT on ammonia volatilization and crop productivity: A meta-analysis. Agronomy Journal 109(1):1–13. doi:10.2134/agronj2016.04.0200
- Wang, Y., Liu, Y., Xia, L., et al. (2025). Accounting for differences between crops and regions reduces estimates of nitrate leaching from nitrogen-fertilized soils. Communications Earth & Environment 6:29. doi:10.1038/s43247-025-02001-0
- USDA Economic Research Service (2018). Cost-effective strategies for reducing cropland nutrient deliveries to the Gulf of Mexico. Amber Waves, September 2018.
- Van Meter, K.J., Van Cappellen, P., Basu, N.B. (2018). Legacy nitrogen may prevent achievement of water quality goals in the Gulf of Mexico. Science 360(6387):427–430.
- IPCC (2019). 2019 Refinement to the 2006 IPCC Guidelines for National Greenhouse Gas Inventories, Volume 4, Chapter 11: N₂O emissions from managed soils.
- IPCC (2021). Climate Change 2021: The Physical Science Basis. Working Group I contribution to AR6, Chapter 7.
- Cui, X., Bo, Y., Adalibieke, W., Winiwarter, W., Zhang, X., Davidson, E.A., Sun, Z., Tian, H., Smith, P., Zhou, F. (2024). The global potential for mitigating nitrous oxide emissions from croplands. One Earth 7(3):401–420. doi:10.1016/j.oneear.2024.01.005
- Shcherbak, I., Millar, N., Robertson, G.P. (2014). Global metaanalysis of the nonlinear response of soil nitrous oxide (N₂O) emissions to fertilizer nitrogen. PNAS 111(25):9199–9204.
- Shih, I.L., Van, Y.T. (2001). The production of poly-(γ-glutamic acid) from microorganisms and its various applications. Bioresource Technology 79:207–225.
- Ashiuchi, M., Misono, H. (2002). Biochemistry and molecular genetics of poly-γ-glutamate synthesis. Applied Microbiology and Biotechnology 59:9–14.
- Luo, Z., Guo, Y., Liu, J., Qiu, H., Zhao, M., Zou, W., et al. (2016). Microbial synthesis of poly-γ-glutamic acid: current progress, challenges, and future perspectives. Biotechnology for Biofuels 9:134.
- Bai, N., He, Y., Zhang, H., Zheng, X., Zeng, R., Li, Y., Li, S., Lv, W. (2022). γ-Polyglutamic acid production, biocontrol, and stress tolerance: multifunction of Bacillus subtilis A-5 and the complete genome analysis. International Journal of Environmental Research and Public Health 19(13):7630. doi:10.3390/ijerph19137630
- Lin, Y., Ding, Y., Shu, L., Chen, H., Li, N., Duan, X., Zeng, W. (2025). Construction of an engineered Bacillus subtilis for production of poly-γ-glutamic acids with specific molecular weights. Frontiers in Microbiology 16:1597704. doi:10.3389/fmicb.2025.1597704
- Guo, J., Zhang, J., Zhang, K., Li, S., Zhang, Y. (2023). Effect of γ-PGA and γ-PGA SAP on soil microenvironment and the yield of winter wheat. PLOS ONE 18(7):e0288299. doi:10.1371/journal.pone.0288299 — linear γ-PGA treatment arm.
- Lin, Y., Wang, L., Shu, L., Chen, H., Liang, Z., Zeng, W. (2026). Effects of poly-γ-glutamic acid molecular weight on lettuce growth, soil properties, and bacterial community structure. Polymers 18(5):640. doi:10.3390/polym18050640
- Jiang, Y., Liu, L., Luo, G., Zhang, Z., Davidmark, J., Huang, Y. (2014). Effect of γ-PGA coated urea on N-release rate and tomato growth. Wuhan University Journal of Natural Sciences 19(4):335–340. doi:10.1007/s11859-014- 1022-4
- Liu, L., Shi, W. (2023). Poly-γ-glutamic acid affects NH₃ volatilization, soil nitrogen content, and soybean seedling growth. Water Supply 23(10):4242–4251. doi:10.2166/ws.2023.228
- Zhang, L., Gao, D., Li, J., Fang, N., Wang, L., Shi, Y. (2017). Effects of poly-γ-glutamic acid on soil nitrogen and carbon leaching and CO₂ fluxes in a sandy clay loam soil. Canadian Journal of Soil Science 97(2):319–328. doi:10.1139/cjss-2016-0127
- Xu, Z., Wan, C., Xu, X., Feng, X., Xu, H. (2013). Effect of poly(γ-glutamic acid) on wheat productivity, nitrogen use efficiency and soil microbes. Journal of Soil Science and Plant Nutrition 13(3):744–755.
- Xu, Z., Lei, P., Feng, X., Xu, X., Xu, H., Yang, H., et al. (2013). Effect of poly(γ-glutamic acid) on microbial community and nitrogen pools of soil. Acta Agriculturae Scandinavica Section B — Soil and Plant Science 63:657–668.
- Bai, N., Zhang, H., He, Y., Zhang, J., Zheng, X., Zhang, H., Zhang, Y., Lv, W., Li, S. (2022). Effects of Bacillus subtilis A-5 and its fermented γ-polyglutamic acid on the rhizosphere bacterial community of Chinese cabbage. Frontiers in Microbiology 13:954489. doi:10.3389/fmicb.2022.954489
- Zhang, L., Gao, J., Wang, L., Sun, Y., Dong, X., Pei, J., Wei, Z., Zhang, L., Shi, Y. (2023). Poly-γ-glutamic acid differentially alters the abundances and communities of N functional genes involved in urea hydrolysis, nitrification and denitrification when applied with different nitrogen fertilizers. Applied Soil Ecology 190:105015. doi:10.1016/j.apsoil.2023.105015
- Zhang, L., Yang, X., Gao, D., Wang, L., Li, J., Wei, Z., Shi, Y. (2017). Effects of poly-γ-glutamic acid (γ-PGA) on plant growth and its distribution in a controlled plant-soil system. Scientific Reports 7:6090. doi:10.1038/s41598-017-06248-2
- Liang, J., Shi, W., He, Z., Pang, L., Zhang, Y. (2019). Effects of poly-γ-glutamic acid on water use efficiency, cotton yield, and fiber quality in the sandy soil of southern Xinjiang, China. Agricultural Water Management 218:48–59.
- Yin, A., Jia, Y., Qiu, T., Gao, M., Cheng, S., Wang, X., et al. (2018). Poly-γ-glutamic acid improves the drought resistance of maize seedlings by adjusting the soil moisture and microbial community structure. Applied Soil Ecology 129:128–135.
- Ma, H., Li, P., Liu, X., Li, C., Zhang, S., Wang, X., et al. (2022). Poly-γ-glutamic acid enhanced the drought resistance of maize by improving photosynthesis and affecting the rhizosphere microbial community. BMC Plant Biology 22:11.
- Chen, L., Fei, L., Wang, Z., Salahou, M.K., Liu, L., Zhong, Y., Dai, Z. (2018). The effects of poly(γ-glutamic acid) on spinach productivity and nitrogen use efficiency in North-West China. Plant, Soil and Environment 64(11):517–522. doi:10.17221/371/2018-PSE
- Liang, J., Shi, W. (2021). Poly-γ-glutamic acid improves water-stable aggregates, nitrogen and phosphorus uptake efficiency, water-fertilizer productivity, and economic benefit in barren desertified soils of Northwest China. Agricultural Water Management 245:106551.
- Wei, L., Cheng, L., Guo, F., Wu, F., Wang, Y. (2024). Influence of biochar and modified polyglutamic acid co- coated urea on crop growth and nitrogen budget in rice fields. Agriculture 14(12):2212. doi:10.3390/agriculture14122212 — γ-PGA-based coating; ¹⁵N-traced, includes direct N₂O and NH₃ measurement.
- Zhai, Z., Shi, W., Liu, L., Jing, B. (2025). Poly-γ-glutamic acid enhances corn nitrogen use efficiency and yield by decreasing gaseous nitrogen loss and increasing mineral nitrogen accumulation. Soil & Tillage Research 249:106480. doi:10.1016/j.still.2025.106480
Explore the Full Science Behind Polyglutamic Acid
Download the complete technical whitepaper to explore how polyglutamic acid influences soil nitrogen cycling, nutrient retention, and crop performance, supported by published research and field studies.
Download the Whitepaper (PDF)